Author: Ryan Grace
October 26, 2024
Good morning my tasty friends, I hope you’re having a wonderful start to your weekend.
It’s been a productive week here in the cave. We’ve been listening to Rick Ross on repeat, testing and fine tuning a new version of the wallet app (Base network connection, upgraded Swap API), and developing more shows to expand the tastycrypto channel.
As you’ll see, we’re also switching up the newsletter format a little bit and we hope you enjoy the content.
Speaking of content… If you’ve only recently boarded the pirate ship… We “perform” live on The tastycrypto Show every Monday and Wednesday at 4:30 PM CT, which you can watch on tastylive.com or on YouTube. – It’s a great show, but sometimes our lawyers advise us against uploading the show recording to the internet, so make sure you tune in live!
If sadly you missed the show this week, we had a great discussion on crypto investing and comparing different blockchain networks and cryptocurrencies using fundamental data.

Do Your Own Research
For many investors, at least nowadays, bitcoin and its digital gold narrative is relatively straightforward. But, what about all the other coins, tokens, networks, projects, and protocols? How do we even think about them, or where do we begin? It’s overwhelming.
One approach we can take is to look at crypto through the lens of fundamental analysis. Like most traditional investments, there’s market and fundamental data we can examine to inform our decisions on an “apples to apples” basis.
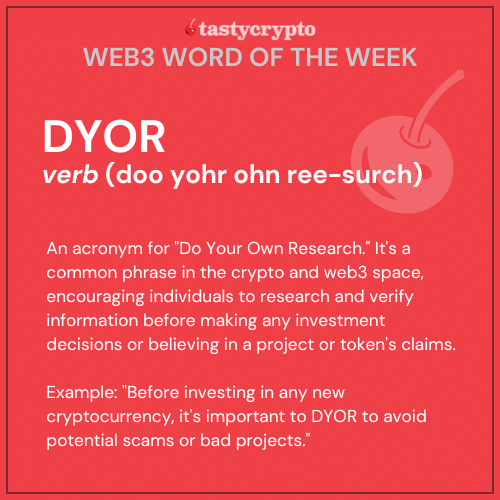
Web3 Word of the Week (W3WOW)
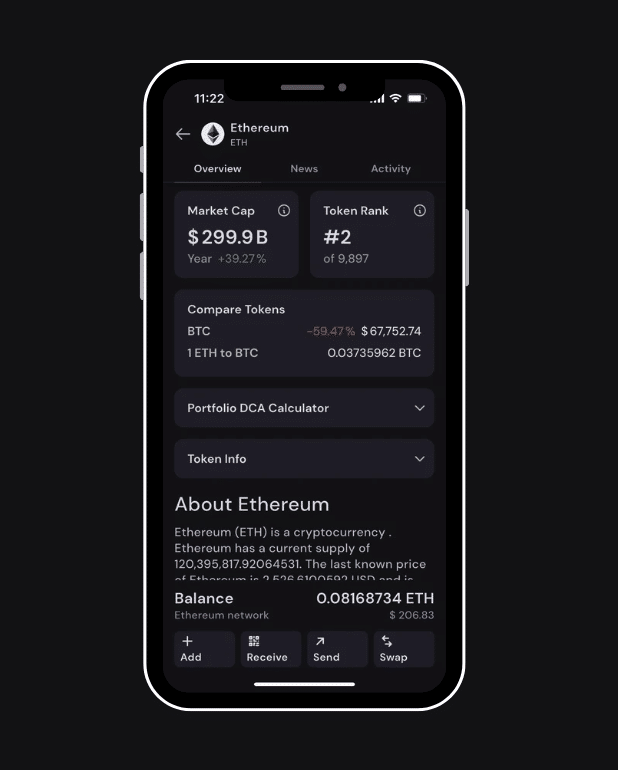
Market Cap
When it comes to evaluating a cryptocurrency, market cap is usually the first metric I’ll look at for a basic sanity check and to get a sense of market valuation and general liquidity.
Market cap represents the total value of a cryptocurrency, based on its token price and the amount of circulating coins/tokens in the market. This is the same as a stock’s market cap, and can help us gain perspective on the scale of the crypto asset and the kind of price movement we might expect.
For context Bitcoin is the biggest by market cap, the “blue chip” of the crypto market. Its high market cap often means it exhibits relatively lower volatility and greater liquidity, which can make it more resilient to market shocks versus alt coins with much smaller market caps.
On the flip side, smaller market-cap assets might have insane growth potential, but with that potential comes increased risk and more volatility. Again, from this perspective, it’s not much different from investing in the stock market.
To me, market cap is also helpful to quickly see if a project is “real” since it’s so easy to launch a token on a blockchain, and there are thousands available. It can also give you an idea of when valuations might be a bit bubbly or where we are in the broader market cycle. I’ve got nothing against the dog coins, but the market cap of DOGE hit $70 billion last cycle. This context can be useful.
There are a ton of great resources for this data such as CoinMarketCap, but it’s also really easy to see on the Coin Details page in the tastycrypto app.
On-Chain Metrics
Beyond surface level insights gleaned from market data, we can also dive into on-chain metrics to better understand network activity and user participation.
If we think of blockchains and decentralized finance protocols as companies… Do these companies have customers? Are people using their products? How much money are they making?
As an indication of network usage and participation, I’ll often use the following data: wallet addresses, transaction volume, and total value locked.
Wallet addresses offer a very straightforward measure of network adoption. An increasing number of active wallet addresses is usually a signal of a growing user base, which could mean sustained adoption and potential future demand. Similar to a social network that’s growing its active user base, a blockchain network with an expanding user base is most likely a positive sign for investors.
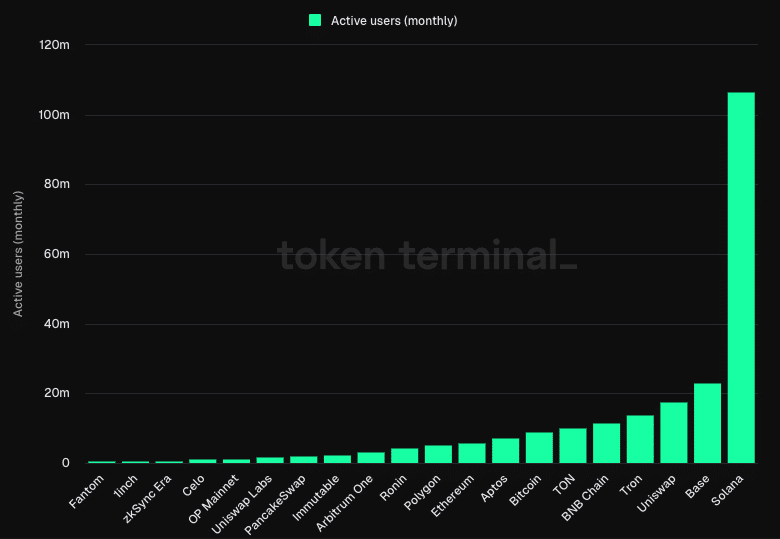
While network adoption might be experiencing a growth spurt, how frequently is the network being used? For this we can look to transactions and volume.
Transactions offer a glimpse into network utility. A high transaction frequency often suggests that the network is actively used for various applications, whether for trading, DeFi, or other blockchain-based services.
In addition to transaction frequency, volume can help us gauge demand.
Transaction volume represents the total value of assets moving across the network. When there’s significant value being transferred on a blockchain network, it’s a pretty good sign of user confidence, liquidity, and overall network reliability.
Similarly, Total Value Locked (TVL) is another metric investors should be aware of, especially when analyzing decentralized finance (DeFi) protocols like Uniswap and others.
TVL reveals how much capital is actually tied up in a protocol. TVL shows the amount of funds locked into a DeFi platform through activities like lending, staking, and liquidity pooling.
A high TVL likely signals an established user base and resulting revenue generation from the DeFi protocol’s services —both signs the network or app is active and attracting real demand. Think of it as DeFi’s way of proving its relevance; the more value locked, the more likely the platform is being used for meaningful transactions and yielding returns for users.
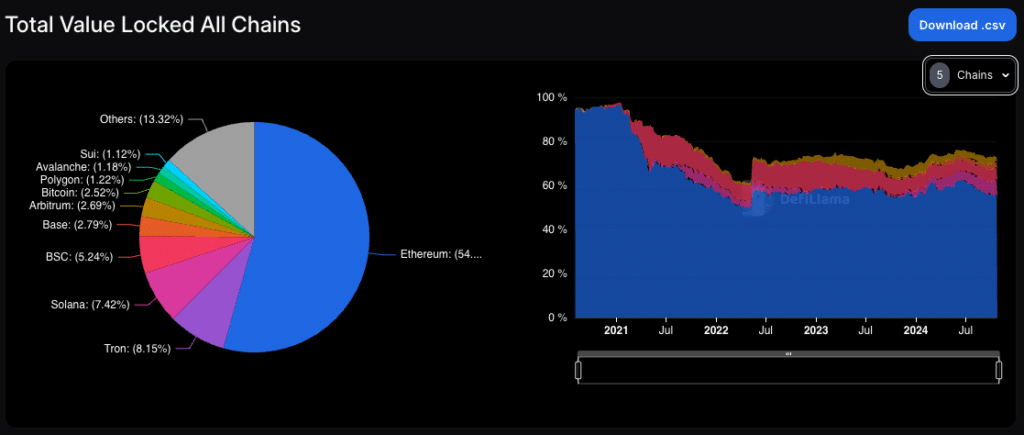
Comparing TVL across platforms can give us a sense of which protocols are leading the pack. For example, Uniswap with its multi-billion dollar TVL often attracts more users and developers than lower TVL counterparts, giving it staying power in the competitive DeFi landscape. A high TVL can also imply better liquidity, which helps to reduce slippage and improve overall trading efficiency.
Development Activity
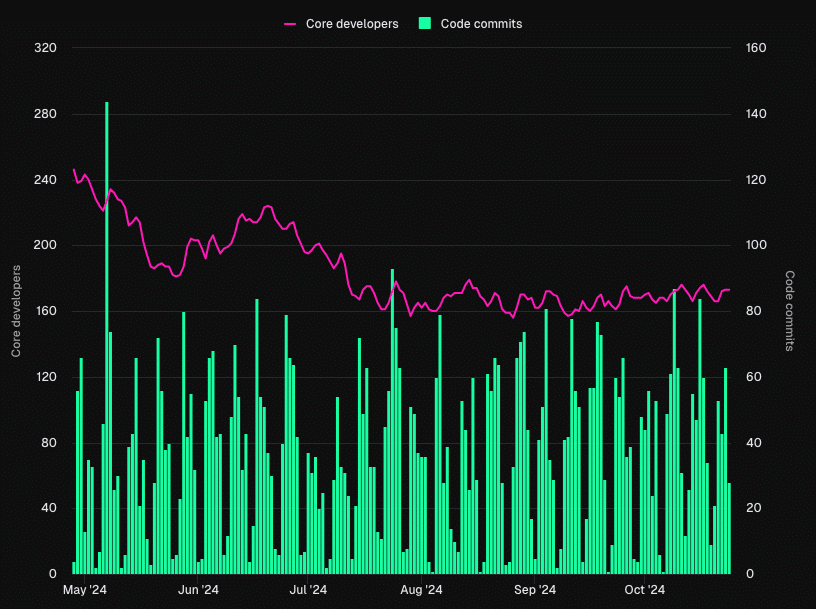
Finally, an overlooked but crucial metric I like to use for fundamental analysis is development activity.
Development activity reflects the number of active developers working on a blockchain network or protocol, as well as the frequency of code updates, improvements, and new features. For investors, dev activity can speaks volumes about a project’s health and dedication to innovation.
Projects with high developer engagement tend to be more resilient, as a strong development team is constantly working to improve the platform, troubleshoot issues, and adapt to market changes. More developers often leads to more utility, leading to more use cases, users, and ultimately more value creation across the network.
For investors, especially those with a long-term perspective, consistent and active development is a good sign a protocol is evolving with the market and has the technical foundation to support growth and adoption into the future.
Ethereum Network Development Metrics:
Crypto Investor Power Tools
We’re working hard to bring a lot of the aforementioned data to the tastycrypto app and you’ll be able to see all of this within the token details section soon.
In the meantime, I’d like to highlight a few of the tools and resources I find very useful for my own investment analysis. These are also the tools we frequently reference and use on the tastycrpto show.
Token Terminal
Token Terminal displays fundamental metrics like revenue, fees, total value locked (TVL), and user and development activity across decentralized applications.
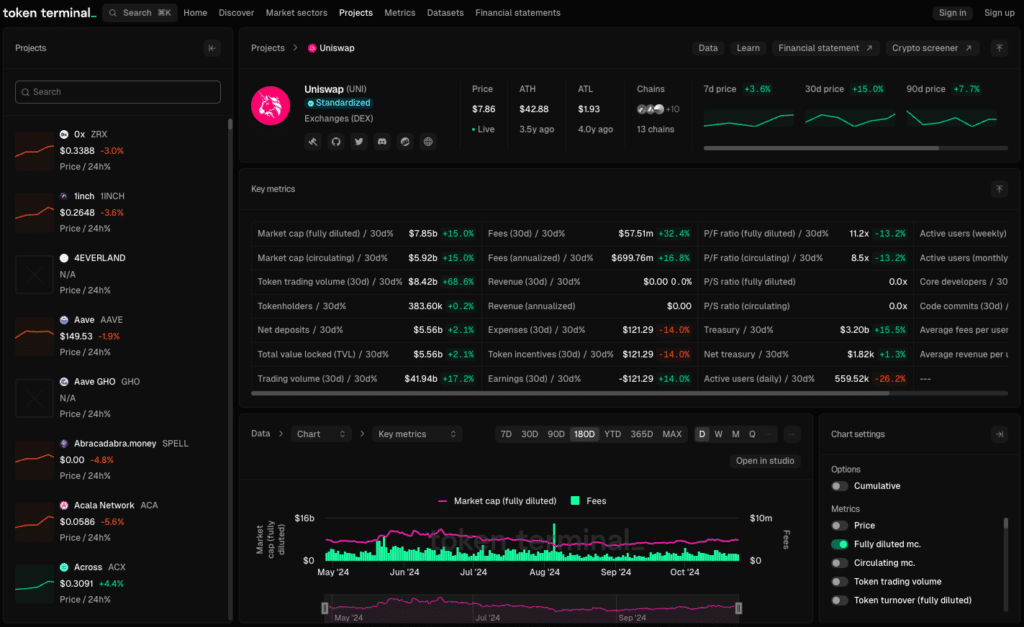
By standardizing and presenting this data, it provides an easy way to compare projects based on real-world traction and growth potential, much like analyzing financial statements in traditional markets.
DeFi Llama
Like Token Terminal, DeFi Llama is another valuable tool for DeFi investors, offering transparent, in-depth data on Total Value Locked (TVL) across various protocols and chains. We use this the most on the show, especially when analyzing liquidity trends and comparing DeFi projects to understand where capital is flowing in real time.
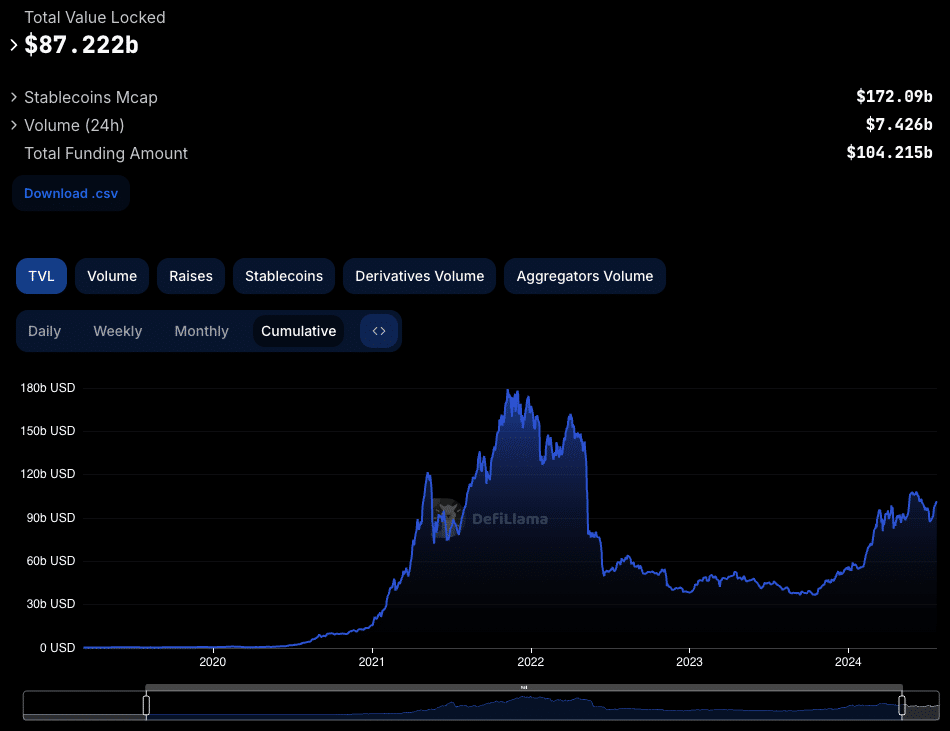
For instance, if you’re evaluating decentralized exchanges (DEXs) or yield farming platforms, DeFi Llama lets you see which protocols are attracting the most liquidity and user activity, helping you make informed investment decisions based on real data.
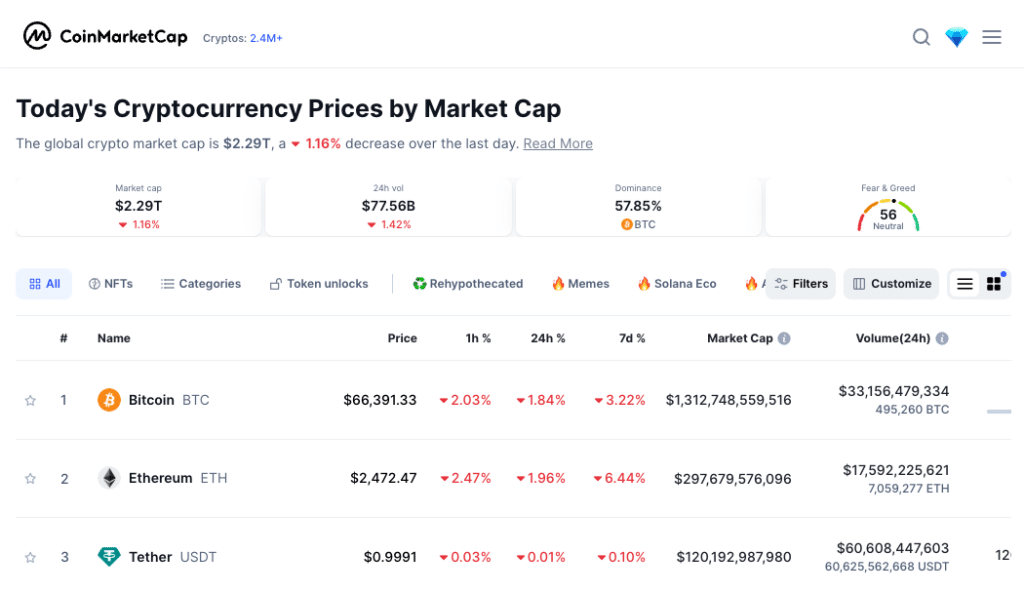
CoinMarketCap
CoinMarketCap provides an easy to use interface for analyzing market data from price action to trading volumes and makes it very easy to compare different tokens across the market.
For even more tools to help with your crypto investment analysis, make sure to check out our guide: The Best Crypto Tools in 2024: Data, Research, Analysis, Charting
- Frank manages to piss off the dog lovers of TikTok and now we’re all worried for his relationship (redemption attempt coming on Monday)
- Glen’s quant-ing leaves us believing there’s cocaine everywhere
- And really wondering how to pronounce ‘Argentina’
- Ryan shares his favorite crypto power tools
Join in the fun and hop in the live chat during the show!
🍒 We’re still collecting name ideas for this new newsletter. Top title ideas will get a an OG tastycrypto t-shirt. Just email your suggestion to support@tastycrypto.com.

