Crypto chart patterns are technical analysis tools used to assess price trends and predict future movements. This article discusses the top 5 chart patterns.
Chart patterns are a technical analysis technique to assess market sentiment and anticipate the next price movements.
The patterns we’re about to discuss have been used for decades by forex and equity traders, but they can be applied with the same success in crypto trading.
You should use the candlestick chart to make the most of these patterns. Most of them work on small and large timeframes.
Understanding crypto patterns can greatly improve trading decisions. Given the high volatility of Bitcoin and altcoins, it’s best to combine these with technical indicators, such as moving averages.
That being said, here are the five best chart patterns for trading crypto:
1. Triangles
Triangles are chart patterns that signal an intensifying battle between bulls and bears, with price action fluctuating within a narrowing range. As a rule, triangles are considered trend continuation patterns, except for symmetrical ones, where the price can go in either direction.
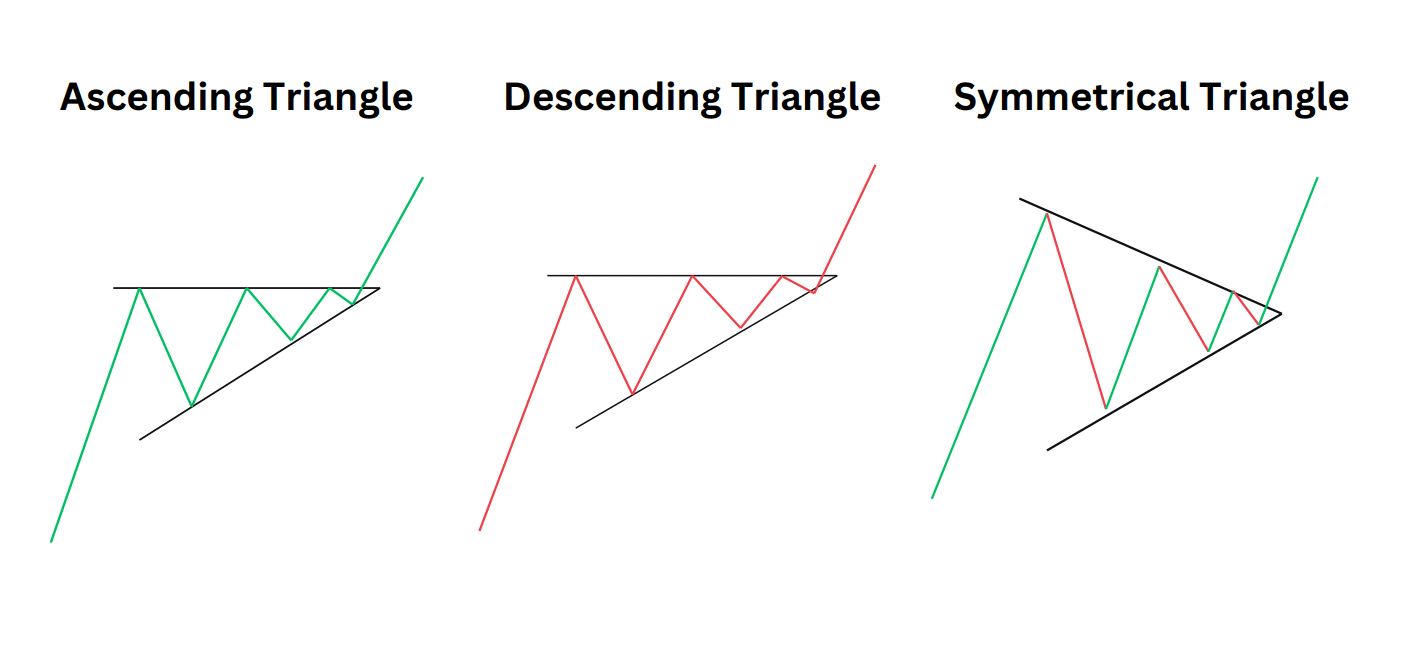
There are three types of triangles:
Ascending triangle – provides a bullish continuation signal, with prices testing a resistance level multiple times, forming higher lows. Traders go long when the price breaks above the upper line of the ascending triangle pattern.
Descending triangle – represents a bearish pattern consisting of a flat support line and a series of lower highs. Traders go short when the price breaks below the lower line.
Symmetrical triangle – this pattern forms when highs and lows narrow and converge to a point amid a period of market consolidation. The price can either continue with the previous general trend or change direction. Traders open positions in the direction of the breakout.
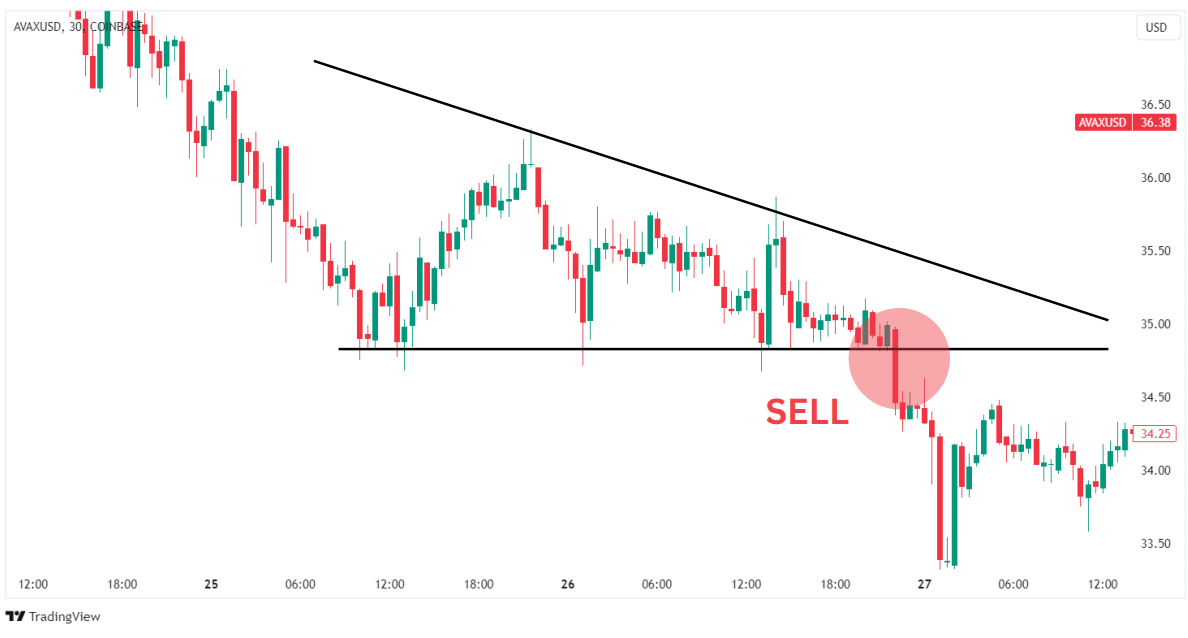
Here is an example of a descending triangle on the AVAX price:
Double tops and double bottoms are some of the most popular trend-reversal patterns.
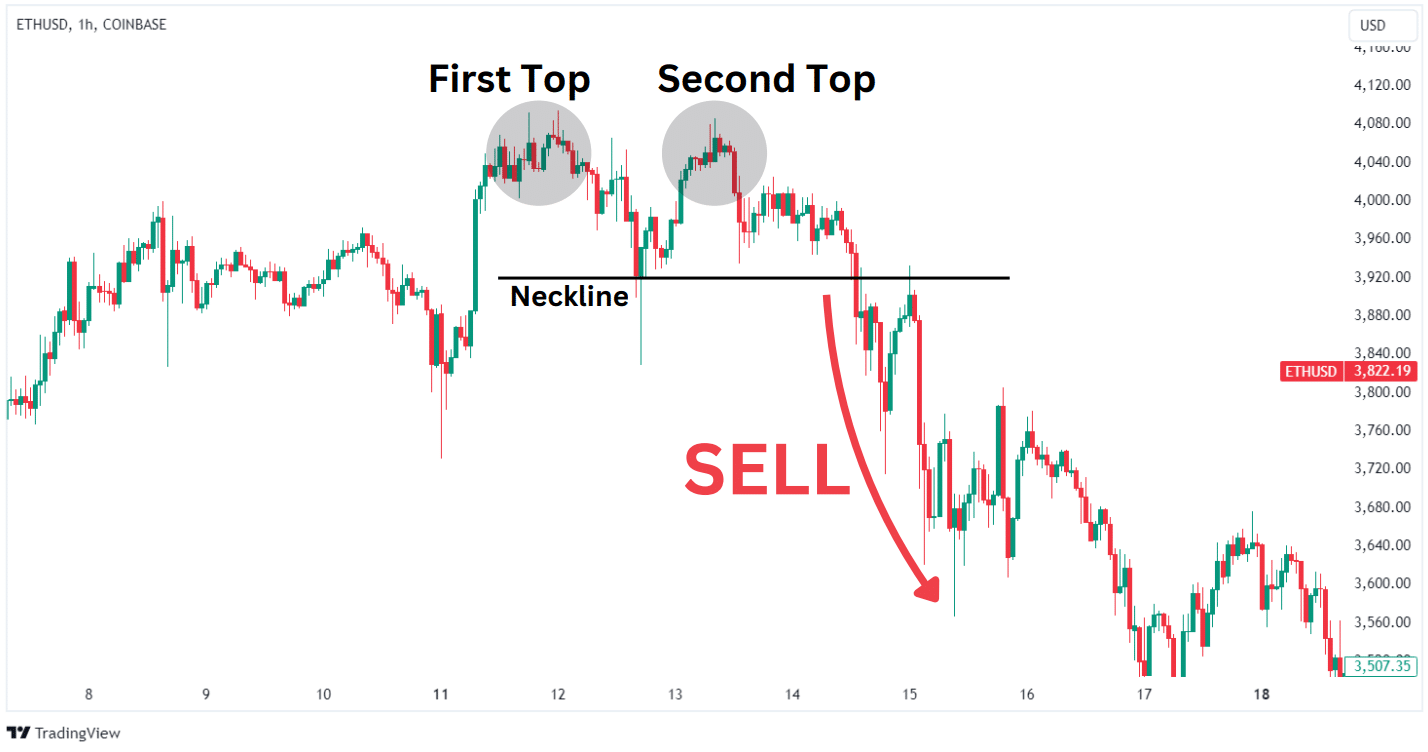
Double tops show up after a strong bullish move. They reflect the following scenario: the price pulls back after facing resistance (the first top) and then returns a second time to test it (the second top).
After failing to break resistance, bears are eventually taking control. Therefore, the pattern consists of two tops and a neckline, representing local support following the initial retracement. Traders go short after the price breaks below the neckline.
Here is an example of a double top formed by the Ethereum price:
Conversely, the double bottom pattern indicates the end of a downtrend, with the price having two unsuccessful attempts to break below the forming support level. Crypto traders open long positions when the price breaks above the neckline.
3. Head and Shoulders
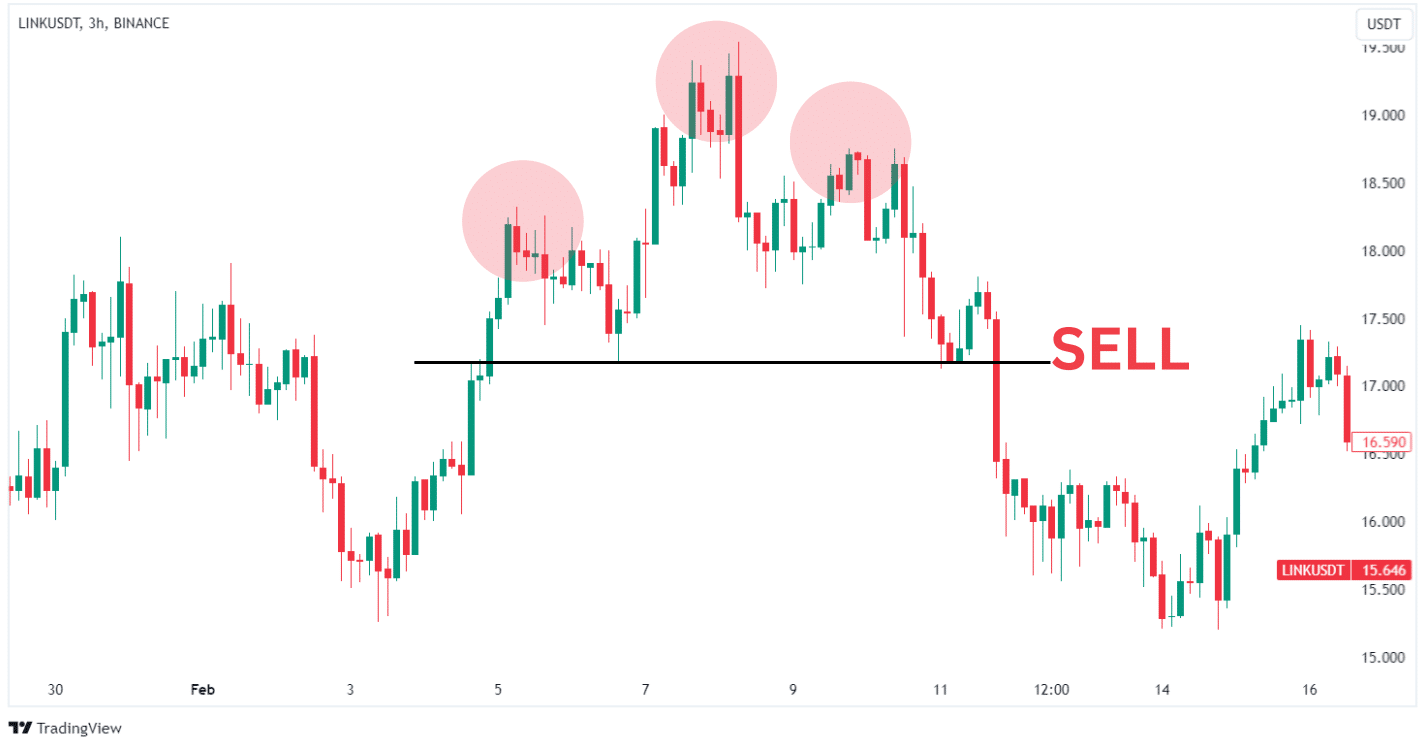
Head and Shoulders is a bearish reversal pattern characterized by three consecutive peaks. The middle peak is the highest (head), while the left and right peaks (shoulders) are ideally relatively at the same level.
However, in practice, one of the outside peaks may be higher or lower than the other. What’s essential is that the pattern resembles a head and two shoulders.
As in the case of double tops, traders open short positions when the price breaks below the baseline (neckline) formed by local support.
Experienced crypto traders can also look for the inverse head and shoulders pattern, which shows up after a strong bearish trend and marks the start of an uptrend. The conditions are the same, and traders go long when the price breaks above the resistance line.
4. Rising and Falling Wedges
Rising and falling wedges resemble triangles, but they are reversal patterns.
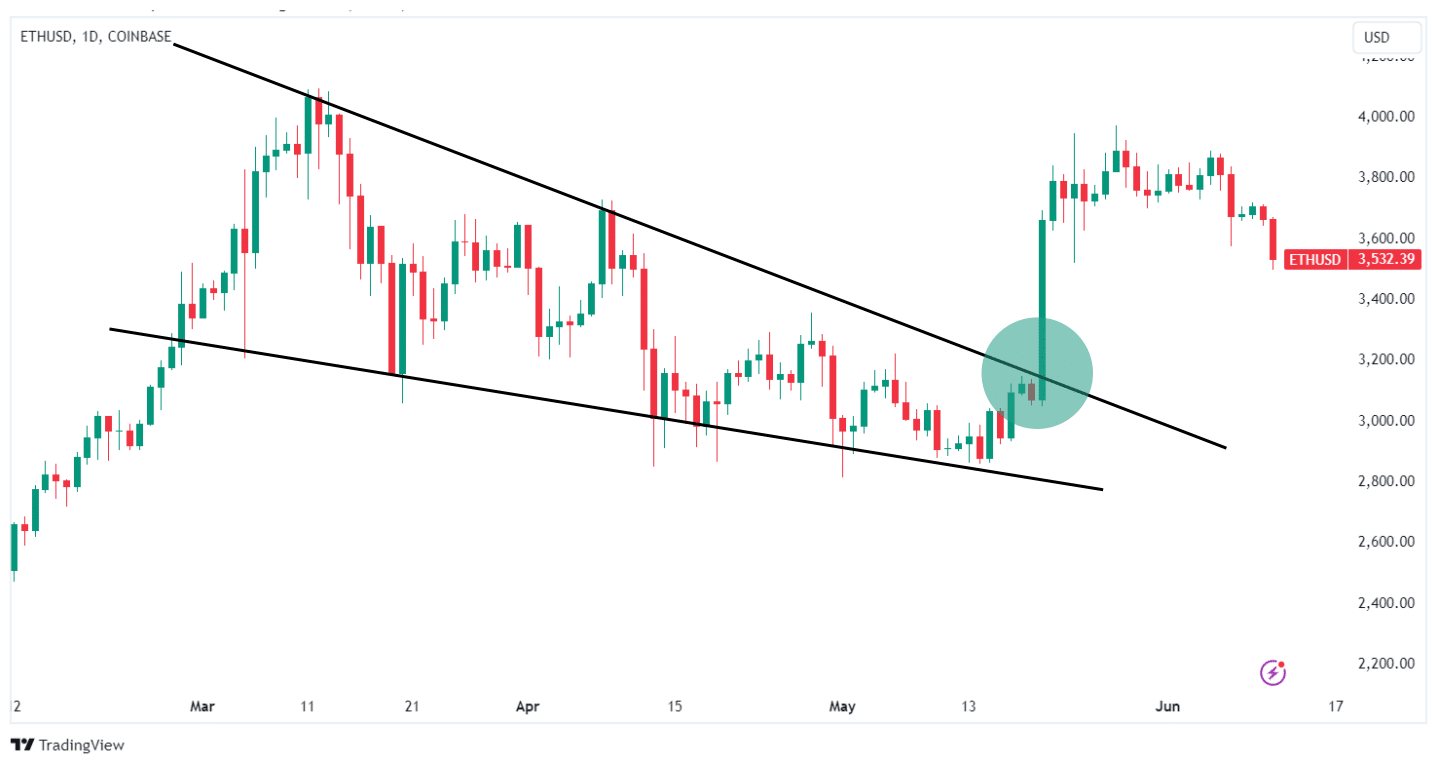
Falling wedges provide bullish reversal signals. They form when the price forms converging highs and lows during a downtrend.
As a rule, the two trendlines of a falling wedge pattern point downward, differentiating them from a descending triangle. In most cases, the price would break above the pattern’s upper line, and traders can open long positions when the breakout is confirmed.
Conversely, rising wedges anticipate a bearish reversal that materializes when the price breaks below the pattern’s bottom line.
For beginners, it’s important to distinguish wedges from triangles because they provide completely different signals.
5. Bullish and Bearish Flags
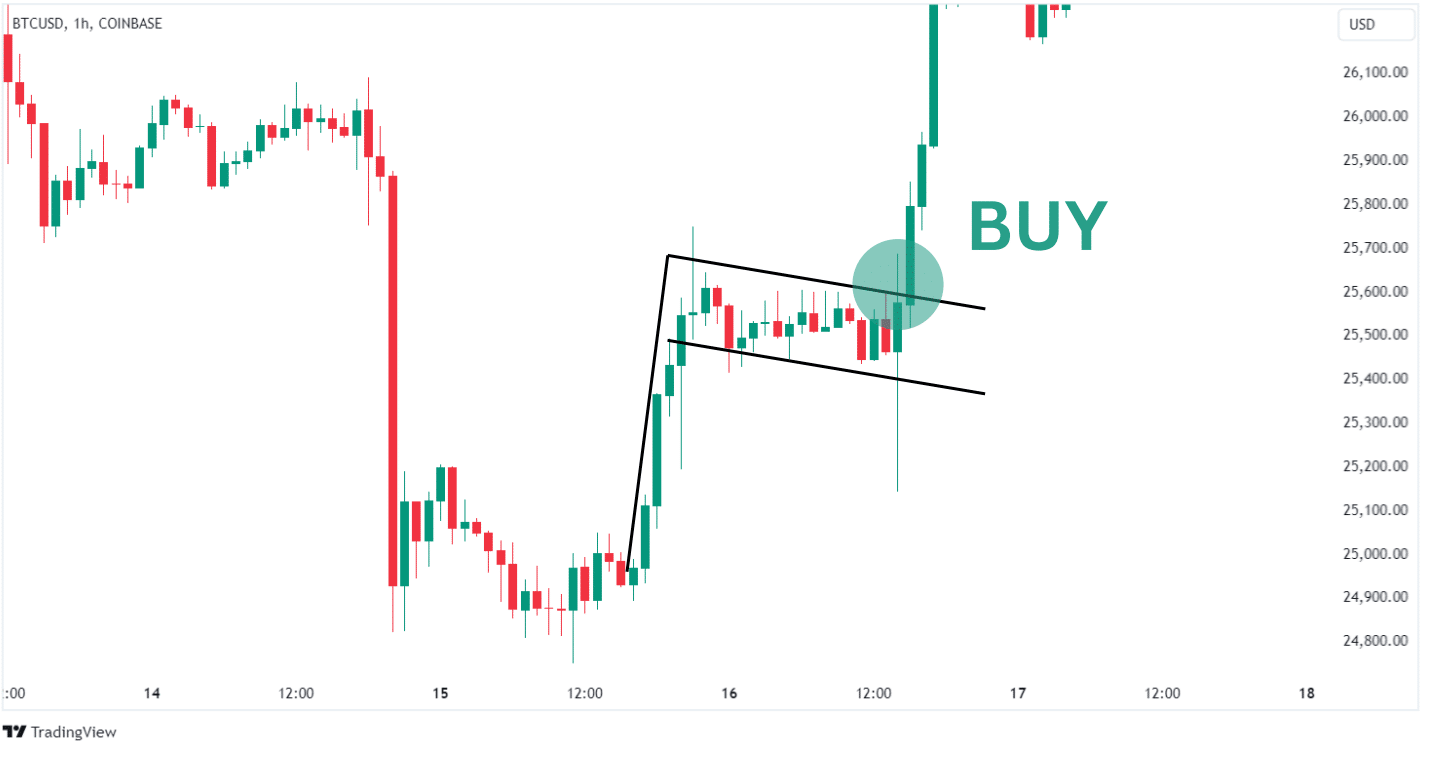
Flags are trend continuation patterns that form when bulls and bears start a fight during a consolidation period but eventually the existing trend continues.
A bullish flag is formed by one or several long bullish candles (the flagpole) and a rectangle slightly inclined downwards (flag). When the price breaks above the resistance line, traders open positions in the direction of the prevailing trend.
Similarly, the bearishflag pattern features one or several red candles and a rectangle inclined upwards. When the price breaks below support, the downtrend continues more confidently.
The flag’s signal becomes more powerful if the breakout is accompanied by rising trading volumes.
FAQs
What crypto chart patterns?
Crypto chart patterns are technical analysis tools traders use to evaluate market trends and predict future price movements. They analyze the shapes and formations that appear on candlestick charts.
What are the best chart patterns in crypto?
Some of the best chart patterns in crypto include Triangles, Double Tops and Double Bottoms, Head and Shoulders, Rising and Falling Wedges, and Bullish and Bearish Flags.
Do crypto patterns work?
Crypto patterns can work effectively as part of a broader trading strategy, especially when combined with other technical indicators to confirm trends and signals. However, they don’t guarantee that the price will behave as expected.
How to reduce risk when trading crypto patterns?
The best way to reduce risk when trading crypto patterns is to use stop-loss orders and never invest more than you can afford to lose.
6+ years of experience writing for crypto brands and blockchain firms, including Coindesk, Cointelegraph, Bitcoinist, CryptoPotato, Algorand, and OTCTrade.com
NEXT TO ORANGE
Sign up to receive news for crypto natives and normies, too.