Happy Saturday! I hope everyone is having a wonderful weekend. May your sports bets cash and your cryptos trade higher.
Speaking of trading higher… Is that more green on the screen I see? Could this be… dare I say, a trend forming?
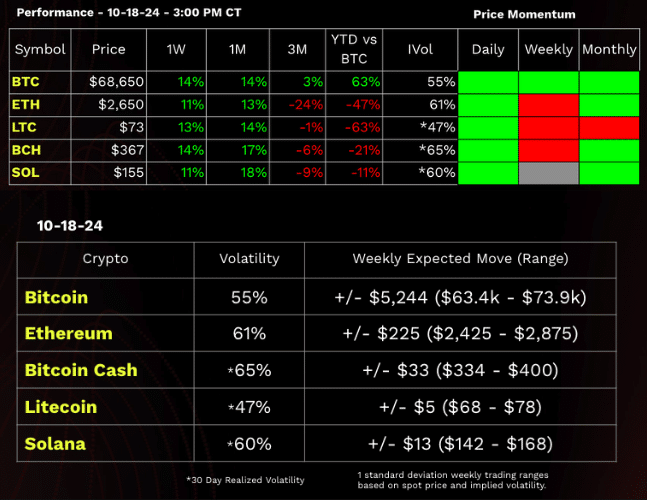
Crypto Performance Dashboard
In this edition of the tastycrypto Newsletter (which we’re in the process of renaming btw), we’re covering the recent price action from big flows to bitcoin dominance and how we’re trading it.
But first, let’s take a look at our crypto performance dashboard below.
A Prelude to Blast Off Mode
Per usual, Glen and I had a blast on the tastycrypto Show this week, where we explored bitcoin’s bullish price action halfway through Uptober and why it could continue post-election.
Positive signs keep stacking up, fueling my conviction that if we can finally break this 70k ceiling, $100,000 BTC is in the cards.
Glen of course thinks it could go much higher.
Market Observations
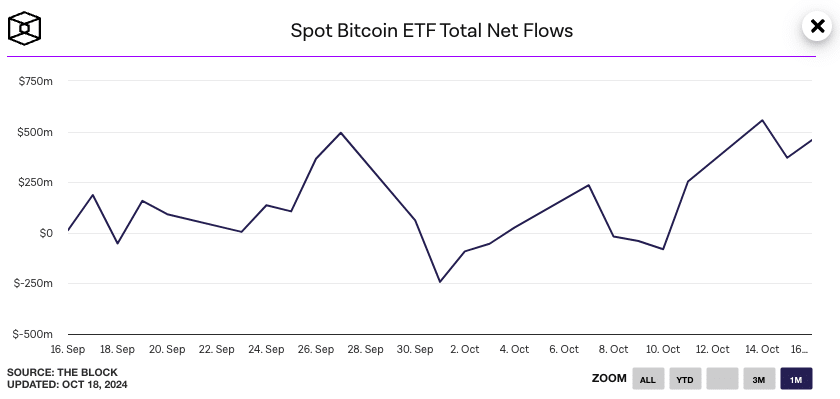
BAF = Big Ass Flows
Anytime we see over $1 billion of aggregate inflows into spot crypto ETFs, I’m putting out the BAF alert.
This week bitcoin and ethereum spot ETFs witnessed a $1.85 billion surge in capital flows, with BlackRock’s IBIT ETF pulling in over $300 million alone. That my friends is some BAF.
Institutional capital continues to pour into bitcoin ETFs, putting cumulative net inflows at $20 billion and ETF assets under management equal to 5% of Bitcoin’s total market cap.
For context, it took gold ETFs 5 years to hit the $20 billion inflow mark.
Could we eventually see BTC ETF AUM hit $100 billion? For even more context, the SPY ETF AUM alone is $600 billion…
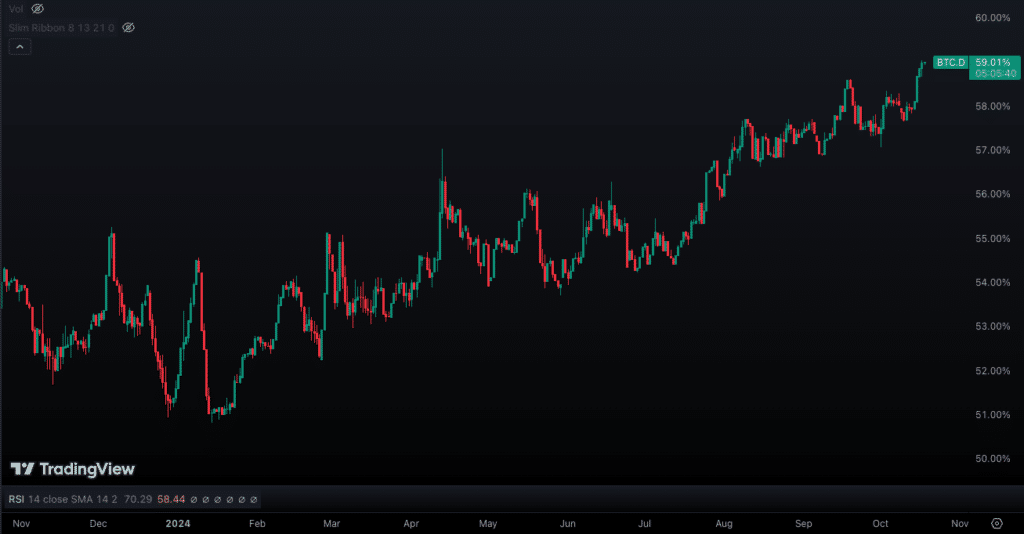
BTC market cap dominance (bitcoin’s market cap relative to the total market cap of crypto assets) is not letting up. With BTC hitting 68k for the first time since July, bitcoin dominance now stands at 59%, the highest level since April of 2021.
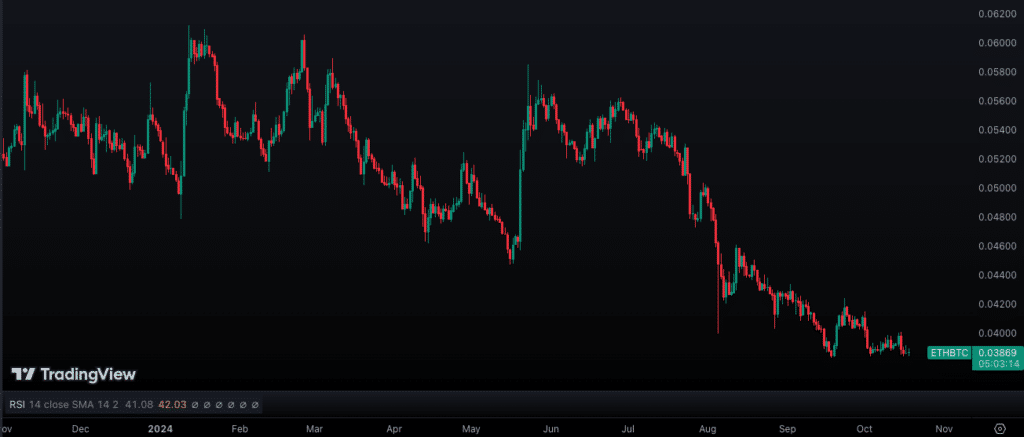
What’s behind Bitcoin’s performance domination? A big factor is Ethereum’s (ETH) relative underperformance.
The ETH/BTC ratio is trading at its lowest point since 2021, with Ether outperforming Bitcoin in only seven of the last 23 months.
This imbalance is strengthening Bitcoin’s grip on the market, as traders continue to favor BTC over ETH.
I think ETH has its moment and sees a relative performance catchup this cycle at some point, but it’s not a trade I’m trying to get in front of.
I’m happy to patiently wait until price action tells me the trend has changed, and getting long ETH/BTC with dominance near 60% doesn’t exactly scream bullish ETH.
Patience is key.
Macro Signals
Outside of the crypto world, the equity market is moving past the slowing growth and slowing inflation scare from early September. Shifting focus now to reaccelerating inflation, signals abound.
On the surface this is generally positive for assets like equities and crypto which can benefit from capital flows into risk assets as investors hedge a slowdown in economic against reaccelerating inflation.
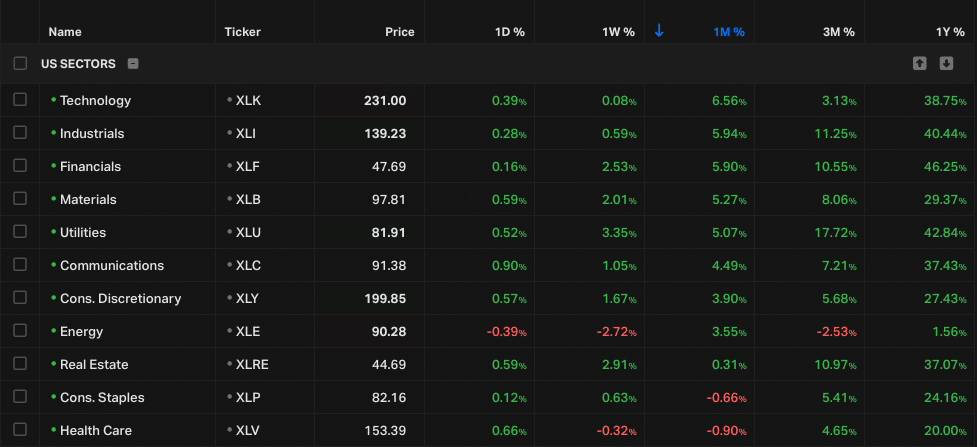
From a sector perspective, there’s also now a much less defensive stance reflected in performance.
Sector Performance:
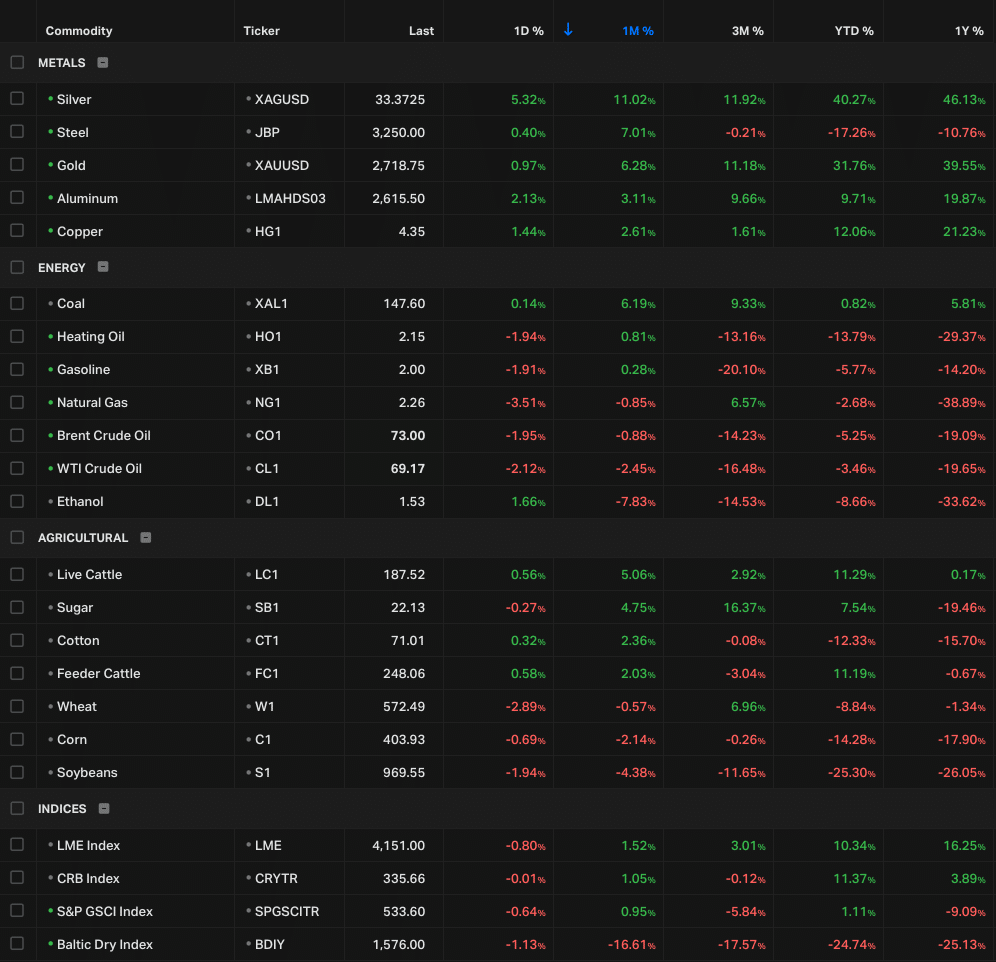
Additionally, we’re seeing a bullish trend developing in many commodities over the past month, with the market narrative now shifting towards sticky or even re-accelerating inflation.
Couple this with the Fed cutting short term interest rates, and you have market conditions for continued asset price inflation and an environment in which Bitcoin could stand to benefit.
Commodity Performance:
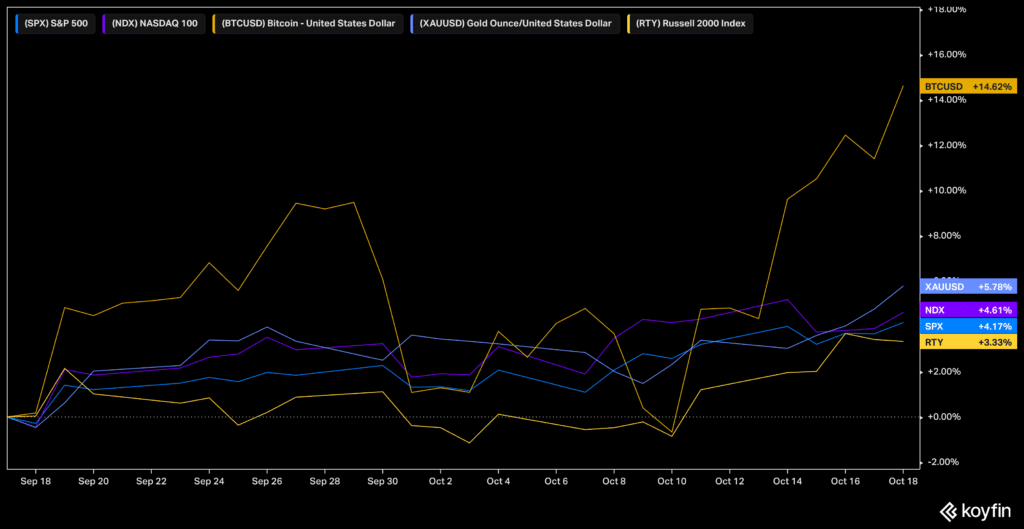
Relative Performance
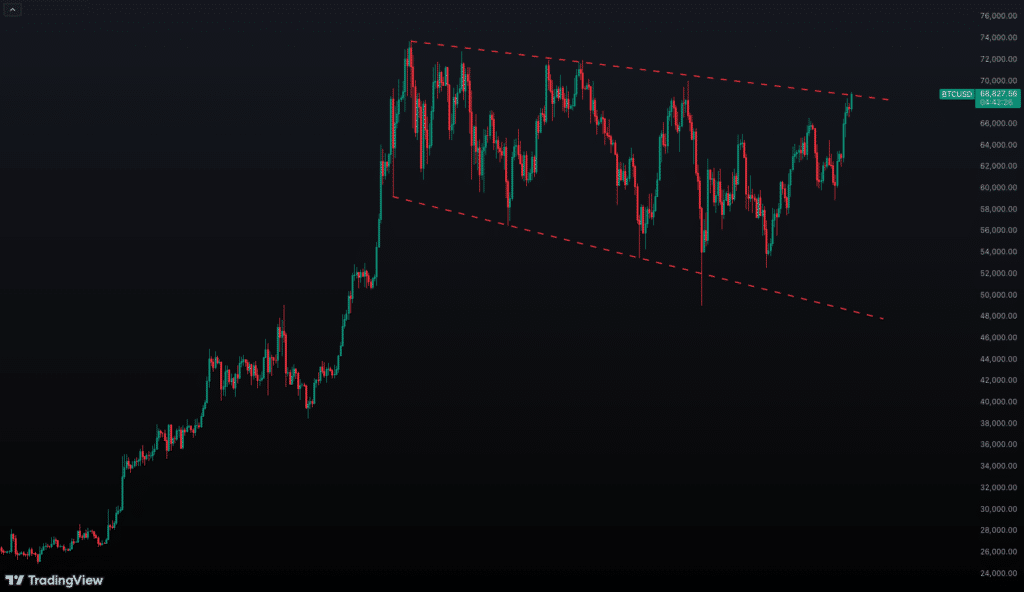
As of writing, we’re nearing $69,000 (hehe) but we haven’t broken out of the range, yet.
The contrarian in me is whispering, “It’s a good time to take some profits.” Which, might be true, especially on a trade basis. If you went shopping in the 50s last month.
There are certainly bullish signals in all of the noise ahead of the election, but as I’ve said many times on The tastycrypto Show, the straightforward trade in my opinion is to buy a breakout above 70 and set a stop under that level if it doesn’t ultimately hold.
Let the market tell you when the chop fest is over and blast off mode is fully engaged.
As I mentioned last week, we’re in the process of making some changes around here… For starters, we’re going to rename the newsletter. That said, our marketing team wasn’t keen on my suggestion of Ryan’s Hot Tips, so we need your help.
I’ve got some OG tastycrypto t-shirts (old logo, very rare, mint condition) that we’re giving away to the top title ideas.
If you have a suggestion for the newsletter’s new name, send it to support@tastycrypto.com. We’ll pick our favorites and then hold a community vote.